Last week I was out to the 2nd Conference on Statistical Practice in New Orleans. It was a great opportunity to meet many users of SAS, R and other software and hear about their projects in applied statistics. I will write up my feedback on this conference soon.
In the meantime, a user chimed in on the SAS communities' page about the need to add URL links to a Box Plot, such that each box would drill down to a page provided by user for more details about that category. The BoxPlot statement in GTL does not support a URL option like some of the other plot statements. We have this feature on request and will address this in the near future.
The user wondered whether it made sense to overlay a scatter plot for the mean value for each box with the URL option to drill to the web page. Far from being "silly" (as per user), this is exactly the right way to deal with many such situations in GTL or SG Procedure programming, where often other plot statements can be leveraged to do something not supported by the statement you are using.
My initial suggestion was to use a transparent Bar Chart instead, as that would cover the entire width of the category, and provide more space for clicking. Also, the cursor change over the entire area of a category would indicate that this can be drilled into. On further discussion, we realized a Bar Chart is not suitable as it enforces the inclusion of "zero" response value, otherwise not present in the graph.
With SAS 9.3, the way to go is to use the HIGHLOW bar as the transparent overlaid plot to provide the drill down feature. Normally, you would make such a plot fully transparent, but I set it to 80% transparent just so we can see the result.
Here is the SAS 9.3 code:
/*--Define the template--*/ proc template; define statgraph BoxURL_1; begingraph; layout overlay / yaxisopts=(label='Mileage'); boxplot x=type y=mpg_city / tip=(none); highlowplot x=type low=mpg_min high=mpg_max / type=bar display=(fill) url=url datatransparency=0.8 rolename=(url=url) tip=(url); endlayout; endgraph; end; run; /*--Render graph to HTML file--*/ ods html file='BoxURL_1.htm'; ods graphics / reset imagemap=on width=5in height=3in imagename='BoxURL_1'; proc sgrender data=cars template=BoxURL_1; run; ods html close; |
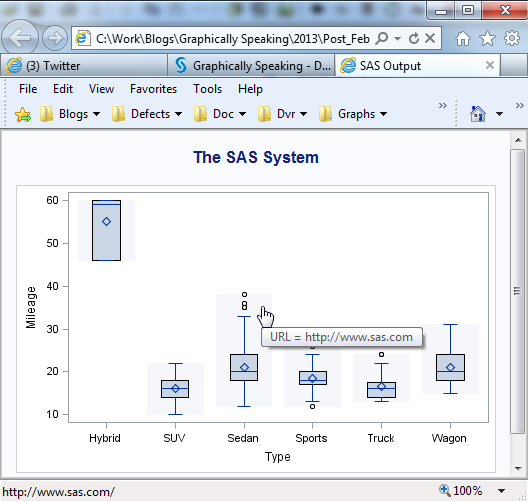
Note the following features in the graph above, which is a screen capture from the IE Browser:
- Each box plot has a faint gray box around it drawn by the HIGHLOW plot with DATATRANSPARENCY=0.8. In the real use case, we would use a transparency of 1.0.
- The tips for the box are turned off, and for the HIGHLOW plot, we set tip=(url) to display the name of the page to be drilled to if clicked.
- In a data step preceding the graph statements, we compute the min and max value for each category value, and set that as the mpg_min and mpg_max values for only one observation per type. Other values are set to missing.
We can make other changes like shown in the second example included in the attached program, where we put the HIGHLOW plot behind the box, and turned on the tooltips for the box. Now, when you mouse over the box element, you will see the tips for the box values. But when you mouse over the HIGHLOW, you will see the drill target.
Full SAS 9.3 program: Box_URL


1 Comment
Thanks for finally talking about > Box Plot with URL links - Graphically Speaking < Loved it!
Also visit my web site :: Cary